| Cooling rates | |
|---|---|
| Air | 5°C/s |
| Oil (still) | 18°C/s |
| Oil (flow) | 45°C/s |
| Water (still) | 45°C/s |
| Water (flow) | 190°C/s |
| Brine (still) | 90°C/s |
| Brine (flow) | 230°C/s |
| Cooling rate: | °C/s | |
| % martensite: | ||
| % pearlite: |
| Cooling rates | |
|---|---|
| Air | 5°C/s |
| Oil (still) | 18°C/s |
| Oil (flow) | 45°C/s |
| Water (still) | 45°C/s |
| Water (flow) | 190°C/s |
| Brine (still) | 90°C/s |
| Brine (flow) | 230°C/s |
| Cooling rate: | °C/s | |
| % martensite: | ||
| % pearlite: |
This is a way of deriving mathematical equations from an image of a graph. This is part of a project for a manufacture engineering class, where the only information we had about a manufactured part's cooling rate was a low quality image of a graph.
For a class project we were tasked with developing an application to calculate the microstructure of a steel part given a certain cooling rate. The only information we were given was the following graph, which described the part's cooling rate and transformation curves.
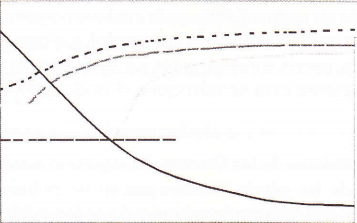
The first step was to isolate each curve manually using GIMP. An image for each curve was produced.

Once each curve was isolated a program was coded in Java to analyze the images. This program analyzed each image pixel by pixel, recording the coordinates of any "dark" pixel.

Each image produced about 1000 points corresponding to the dark pixels. A program was coded in R that took as input all of these points and returned a sixth order polynomial equation that described a regression line that fitted the points.

The equations and the graphs were obtained. The following images show the points (dark circles) and the regression line (green curve)


With the polynomial's coefficients the lines were all graphed in a single graph and the intersection points are found.

This information was used to build an application that given a cooling rate will calculate the part's microstructure.